New Study: Update of WEEE Collection Rates, Targets, Flows, and Hoarding
1 year ago Ruediger Kuehr Comments Off on New Study: Update of WEEE Collection Rates, Targets, Flows, and Hoarding
A new study commissioned by the WEEE Forum provides key statistics of WEEE flows, collection rates in the EU-27, Norway, United Kingdom, Switzerland, and Iceland from 2010 to 2021 by integrating several data sources.
 This is an update of the timeseries of the previous study “In-depth Review of the WEEE Collection Rates and Targets in the EU-28, Norway, Switzerland, and Iceland” by UNITAR. Data on Electrical and Electronic Equipment (EEE) Placed on Market (POM) and WEEE collection managed by formal collection system Figures up to 2019 are based on the data collected within the framework of the WEEE Directives.
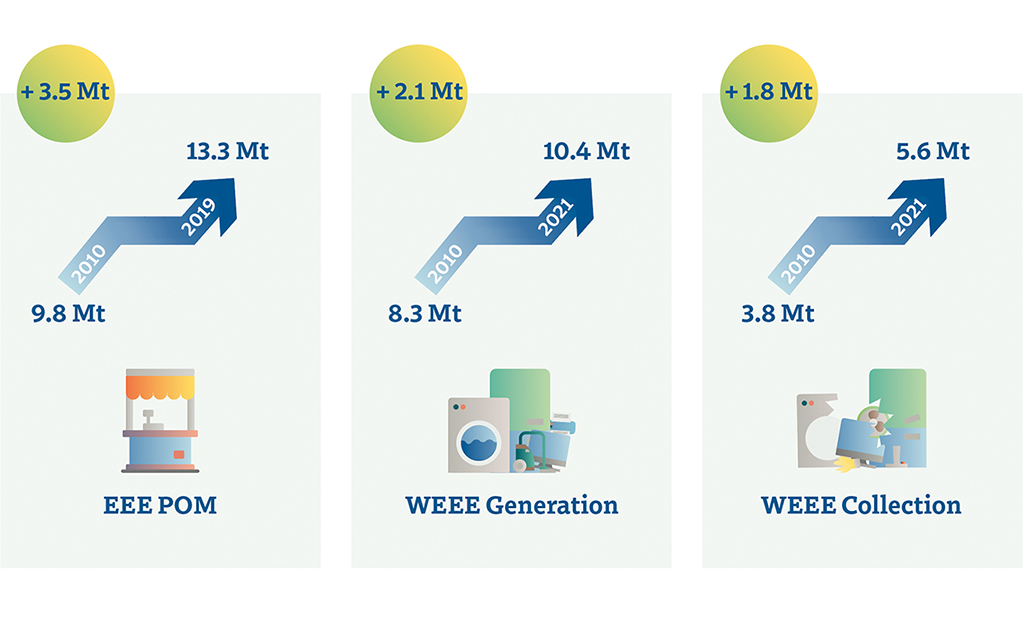 The study reveals that the amount of EEE POM in the 27 Member States of the EU, Norway, United Kingdom, Switzerland, and Iceland increased from 9.8 million metric tonnes, hereafter referred to as Mt,(1) in 2010 to 13.3 Mt in 2019 (25.2 kg/inhabitant). The WEEE generated also shows an increase of 2.1 Mt, from 8.3 Mt in 2010 to 10.4 Mt (19.6 kg/inhabitant) in 2021. The documented formal collection of WEEE shows an increase of 1.8 Mt, from 3.8 Mt in 2010 to 5.6 Mt (10.5 kg/inhabitant) in 2021.
WEEE Directive describes two methods for calculating the collection rate in the EU Member States. The “WEEE Generated method” is calculated by mass of WEEE collected divided by the mass of WEEE Generated in the same year. The collection rate increased from 40% in 2014 to 54% in 2021 using this method. The increases are mainly driven by the significant increases of the WEEE collection compared to the WEEE Generation. The second method is the ‘EEE POM method’, which is calculated as the mass of WEEE collected divided by the average amount of EEE POM in the three preceding years. The collection rate using the EEE POM method increased from 39% to 50% from 2013 to 2016. From 2016 to 2020, the collection rate dropped to 44%. Despite the significant increases of WEEE collection, the decrease in the collection rate is caused by even larger increases of the EEE POM, causing the collection rate to decrease, using this method.
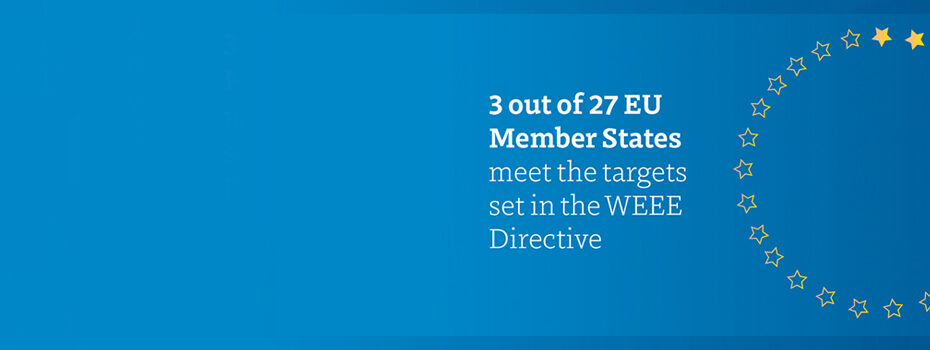
The Member States of the EU can annually choose either method for the calculation of the WEEE collection targets. For the WEEE Generated method, the target is 85%, and for EEE POM, the target has been 65% since 2019. In considering all individual countries, only three of the 27 EU Member States (Croatia, Bulgaria, and Poland) have reached the collection target of the WEEE Directive, according to the latest set of data available in this study. Switzerland does not have such targets in place, but would meet the EU target. The countries that reach the targets seem to contradict both the overall trend and the underlying factors observed across the rest of the EU. Besides official government statistics, there are no additional public reports or underlying information available that allow for a better understanding of the collection rates.
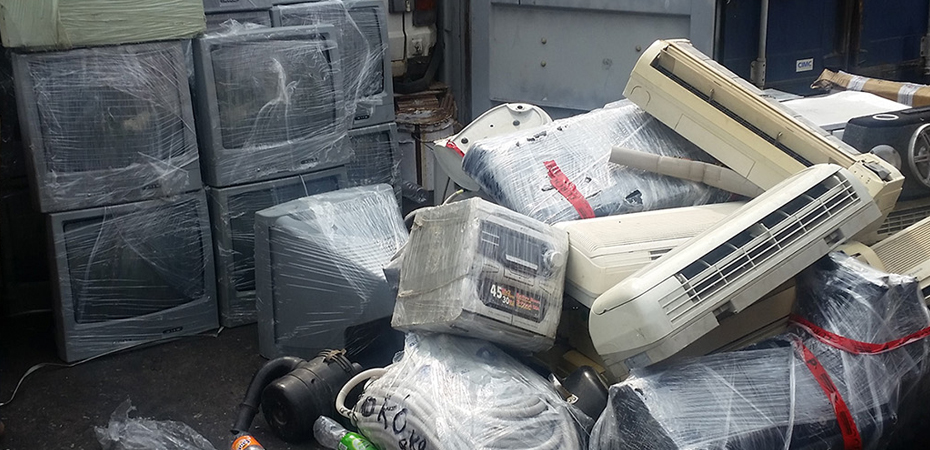
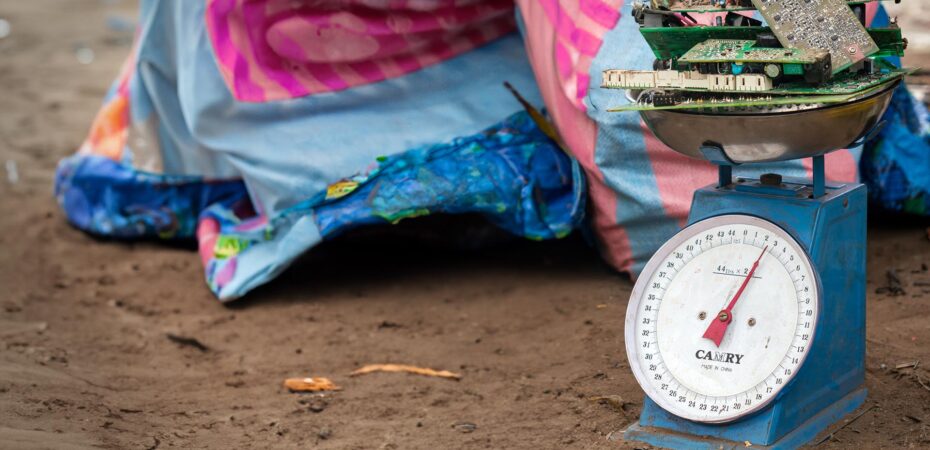
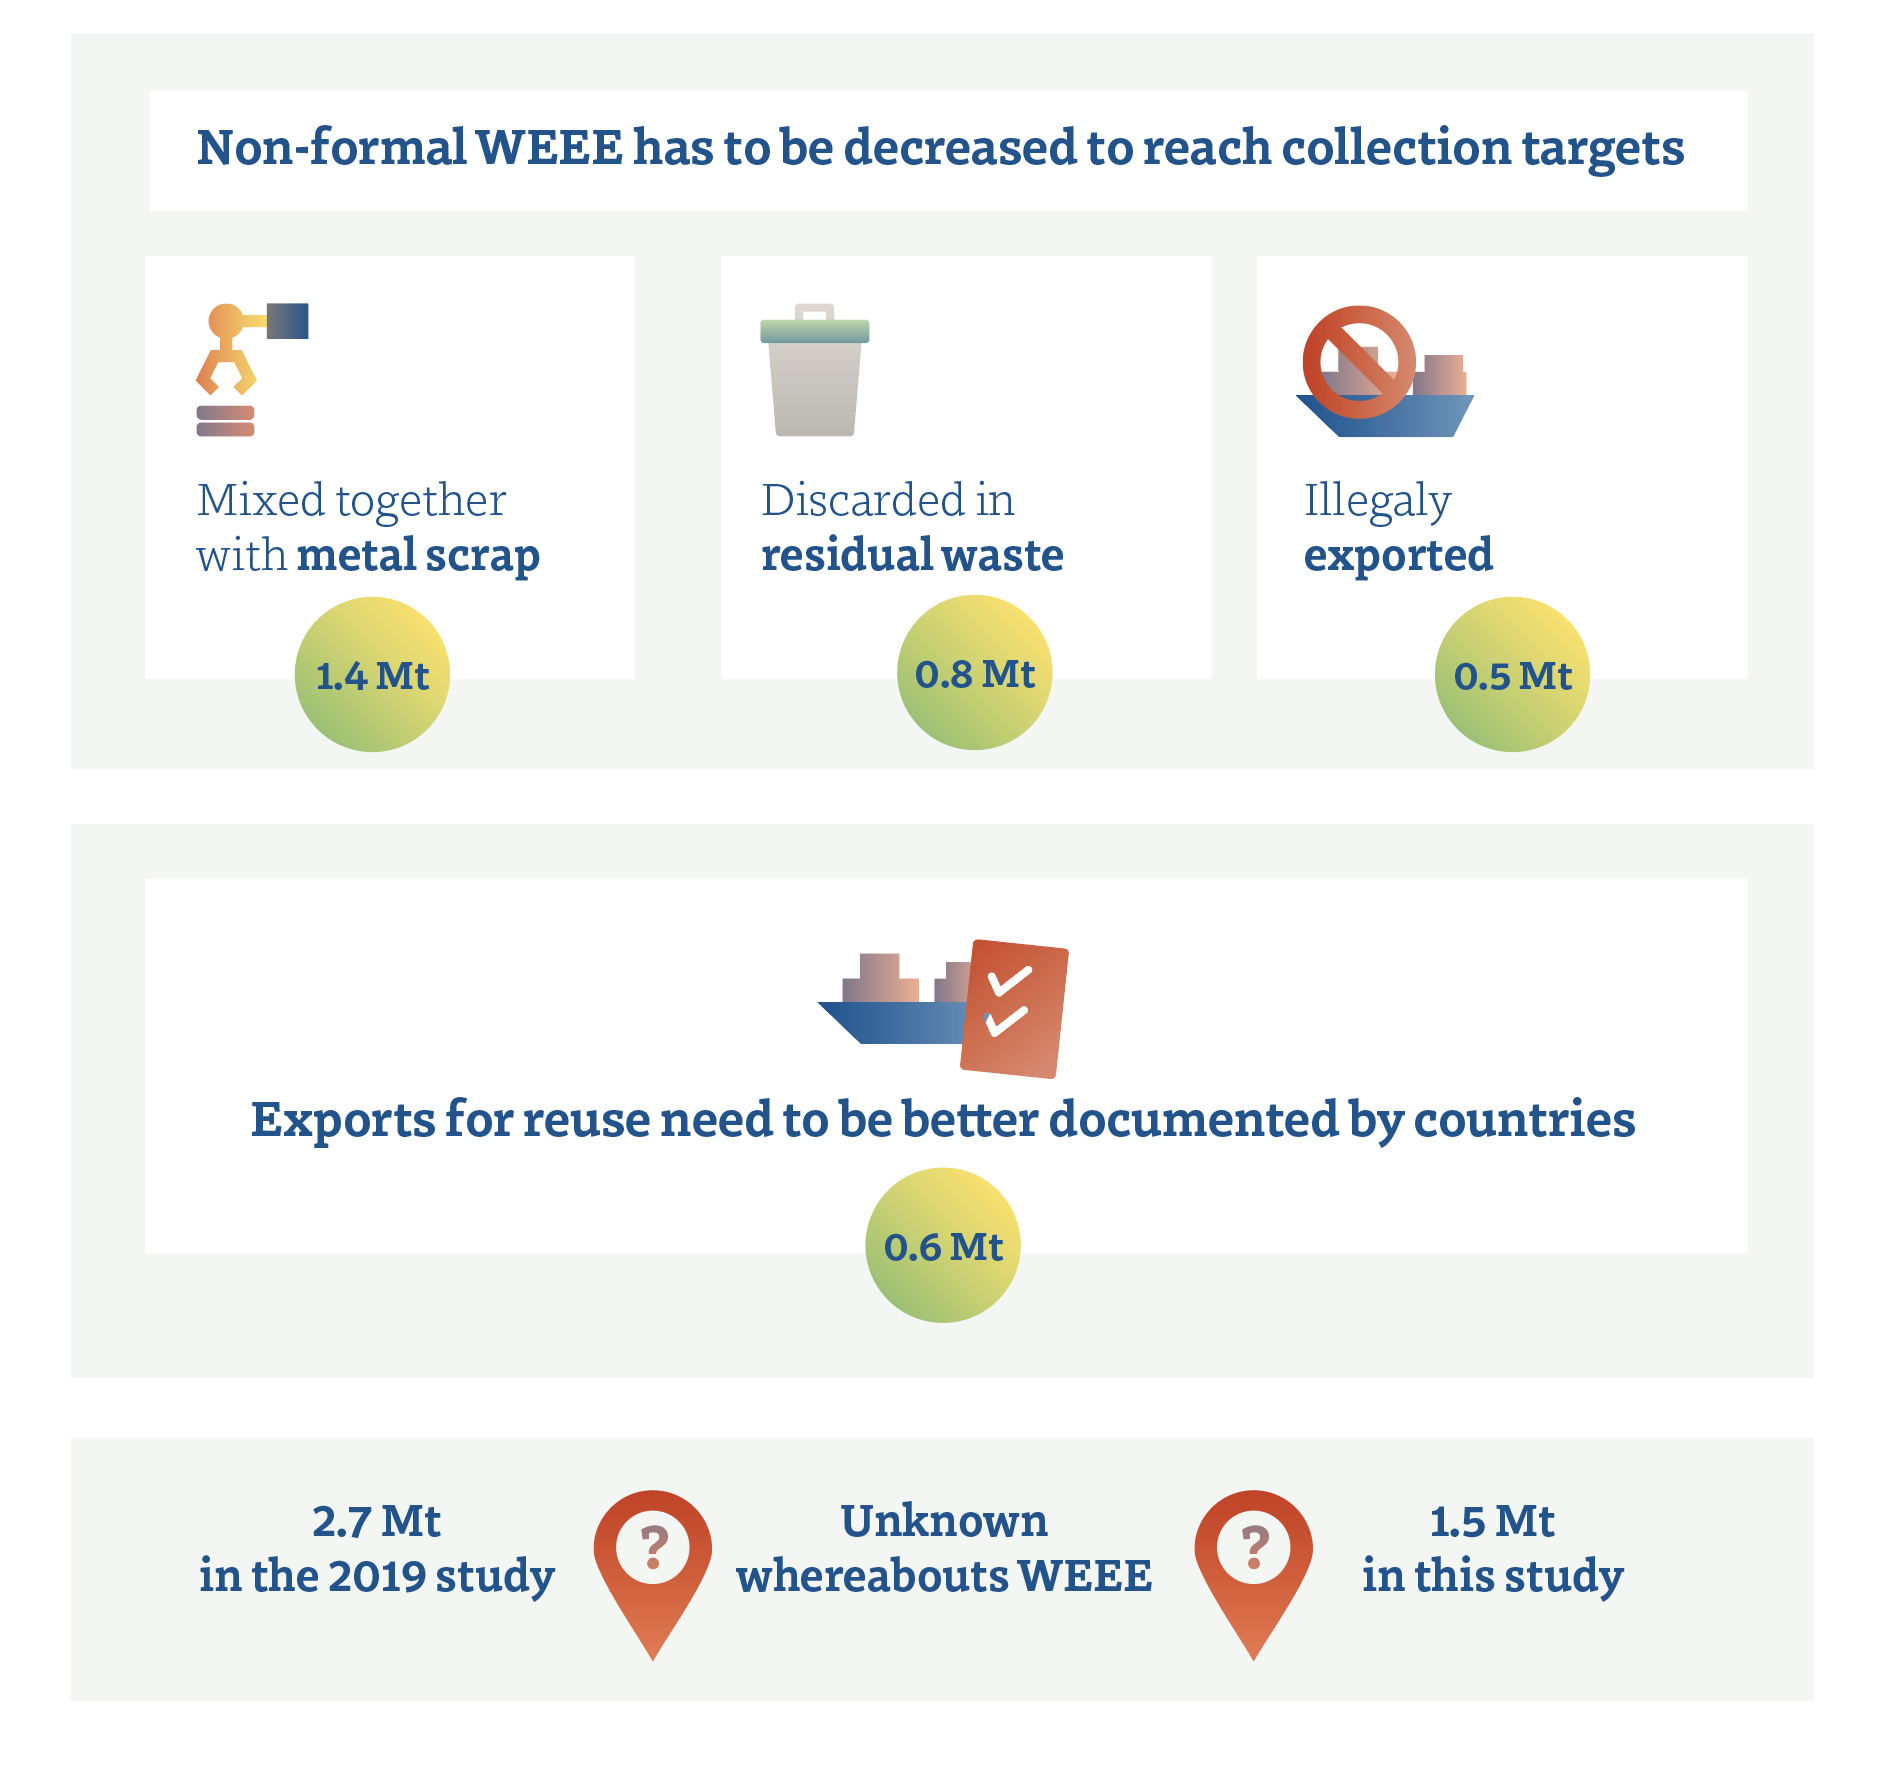 One of the obstacles in reaching collection targets is that considerable amounts of WEEE are diverted to other, undocumented WEEE flows. Unwanted WEEE flows need to be reduced and steered into the formal WEEE management regime. It is estimated that 1.4 Mt (2.7 kg/inhabitant) was collected with metal scrap to be recycled, but not with the same environmental and material efficiency standards as the formally managed WEEE. Approximately 0.8 Mt – 1.5 kg/inhabitant – of WEEE is estimated as being disposed of with mixed residual waste and ends up in incinerators and landfills. It is estimated that 0.5 Mt – 1 kg/inhabitant – is illegally exported outside the EU27. As well, 0.6 Mt – 1.1 kg/inhabitant – of EEE is estimated to be exported for reuse. The exports for reuse and illegal exports are hardly monitored in most countries, also due to the lack of trade codes for used-EEE. Better monitoring of used-EEE exports is essential in order to distinguish legal used EEE exports from exports of illegal WEEE. WEEE illegally exported often ends up illegally dumped in countries with no formal management systems. The legal exports of used-EEE could be corrected in the collection target, as they do not typically become waste in the country where they have been placed on the market initially. In the previous study over reference year 2019, the whereabouts of 2.7 Mt of WEEE were unknown. In this study, the unknown has reduced to 1.5 Mt of WEEE – 1.9 kg/inhabitant – over 2021. The unknown WEEE can still be part of the previous mentioned flows or could be uncertainties in the calculations.
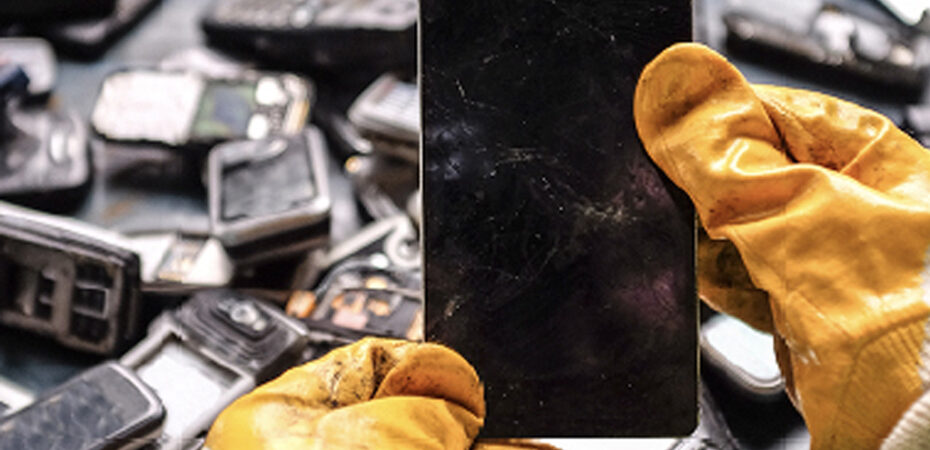
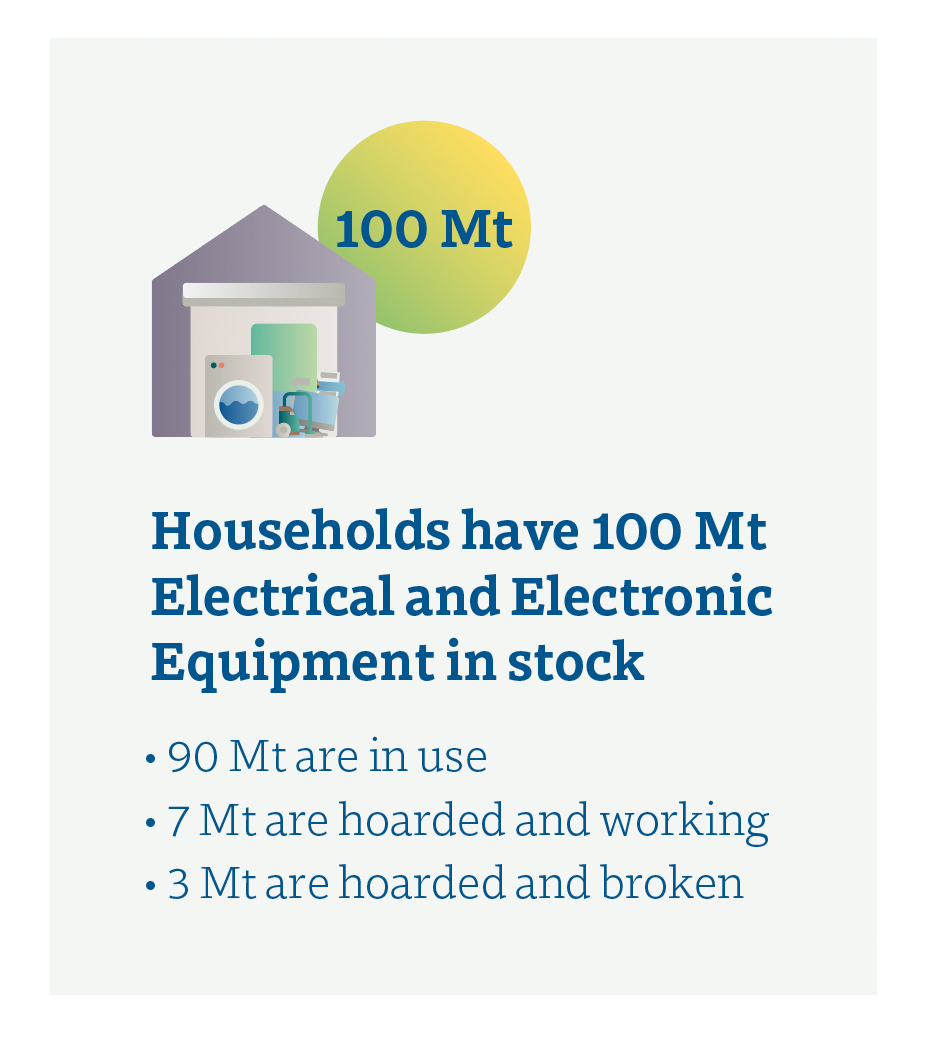 Novel statistics on hoarding – of used EEE and WEEE stored in households – show that households own an average of 74 EEE items (excluding lamps and luminaires), of which 61 items are in use, nine are hoarded but working, and four are hoarded and not working. The total mass of items in households is 90 Mt, of which 7 Mt is hoarded and working, and 3 Mt is hoarded and broken. The small items (including lamps and luminaires) dominate when counted as individual items, whereas large items dominate by weight. The types of EEE or WEEE that are mostly hoarded by comparing the stock in households of that equipment are smaller items, such as small IT equipment (17%) and small equipment (14%). Screens and monitors are third-highest at 14% and are comprised of obsolete cathode ray tube monitors, televisions, flat-panels monitors, and televisions replaced by laptops. The lowest hoarding rates are found for category large equipment (9%) and category temperature exchange equipment (8%), which are large in size and therefore often less hoarded when the use phase is over.
Download publication (pdf): Update of WEEE Collection, Rates, Targets, Flows, and Hoarding – 2021
